Nagios is one of the most widely used open source monitoring tools which helps us to monitor the services and applications that runs of Windows, Linux, Routers and other network devices.
With the help of Nagios, we can monitor basic services and attributes. We can access the Nagios using web interface coming with the bundle and configuration need to be done on the file level.
Prerequisites
Before installing Nagios, the system need to meet few requirements for installing Nagios. Let's install those prerequisites like httpd(web server), php(scripting language), compilers and development libraries.
We can install these prerequisties through a single command. Here we go:
As we have just installed our prerequisites, let's create a nagios user, nagcmd group for allowing the external commands to be executed through web interface and add nagios, apache user to the nagcmd group.
useradd nagios
groupadd nagcmd
usermod -a -G nagcmd nagios
usermod -a -G nagcmd httpd
Install Nagios Core
Let's download latest version of Nagios Core using the terminal or CML(command line).
cd ~ curl -L -O https://assets.nagios.com/downloads/nagioscore/releases/nagios-4.1.1.tar.gz
tar xvf nagios-*.tar.gz
cd nagios-*
After building Nagios, we must compile it with this command.
./configure --with-command-group=nagcmd
Now compltete Nagios with this command.
make all
make install
make install-init install-config install-commandmode install-webconf
Note: The purpose of the make utility is to determine automatically which pieces of a large program need to be recompiled, and issue the commands to recompile them. you can use make with any programming language whose compiler can be run with a shell command.
Install Nagios Plugins
You can find the latest release of the Nagios Plugin and install.
cd ~
curl -L -O http://nagios-plugins.org/download/nagios-plugins-2.1.1.tar.gz tar xvf nagios-plugins-*.tar.gz cd nagios-plugins-* ./configure --with-nagios-user=nagios --with-nagios-group=nagios --with-openssl make
make install
Install NRPE
You can find the source code for the latest stable release of NRPE
cd ~
curl -L -O http://downloads.sourceforge.net/project/nagios/nrpe-2.x/nrpe-2.15/nrpe-2.15.tar.gz tar xvf nrpe-*.tar.gz cd nrpe-*
Now build and install NRPE and its xinetd startup script with these commands:
make all make install make install-xinetd make install-daemon-config
Open the xinetd startup script in an editor:
sudo vi /etc/xinetd.d/nrpe
Modify the only_from line by adding the private IP address of the your Nagios server to the end
only_from = 127.0.0.1 {Nagios server Private IP}
Save and exit. Only the Nagios server will be allowed to communicate with NRPE.
Restart the xinetd service to start NRPE:
service xinetd restart
Nagios Configure:
Till now, we have installed the nagios, required plugins, we need to configure them. You only need to perform this section once, on your Nagios server.
Organize Nagios Configuration:
Open the main nagios cofiguration file and make changes.
vi /usr/local/nagios/etc/nagios.cfg
Find and uncomment below line now and then save it.
#cfg_dir=/usr/local/nagios/etc/servers
Now create the directory that will store the configuration file for each server that you will monitor:
mkdir /usr/local/nagios/etc/servers
Configure Nagios contacts:
Open the Nagios contacts configuration file and make changes. We have to edit this config file /usr/local/nagios/etc/objects/contacts.cfg by changing the email address.
vi /usr/local/nagios/etc/objects/contacts.cfg
Change the email address filed to receive the notifications.
Configure check_nrpe Command:
Let's add a new command to our Nagios configuration.
Enter a password at the prompt. Remember this login, as you will need it to access the Nagios web interface.
Note: If you create a user that is not named "nagiosadmin", you will need to edit /usr/local/nagios/etc/cgi.cfg and change all the "nagiosadmin" references to the user you created.
Now we are all done with Nagios configuration and its time to verify it and to do so please insert following command.
/usr/local/nagios/bin/nagios -v /usr/local/nagios/etc/nagios.cfg >> MOST IMP CONF FILE
Output:
Nagios Core 4.4.3
Copyright (c) 2009-present Nagios Core Development Team and Community Contributors
Things look okay - No serious problems were detected during the pre-flight check
If output shows up as above, configuration file is good and we can proceed to start the Nagios service, nagios on system startup.
Nagios is ready to be started. Let's do that, and restart Apache:
systemctl daemon-reload
systemctl start nagios
systemctl restart httpd
To enable Nagios to start on server boot, run this command:
chkconfig nagios on
Login to the Nagios Web Interface
Now access the Nagios web interface using the following URL. You’ll be prompted for the username (nagiosadmin) and password you specified earlier.
http://localhost/nagios/
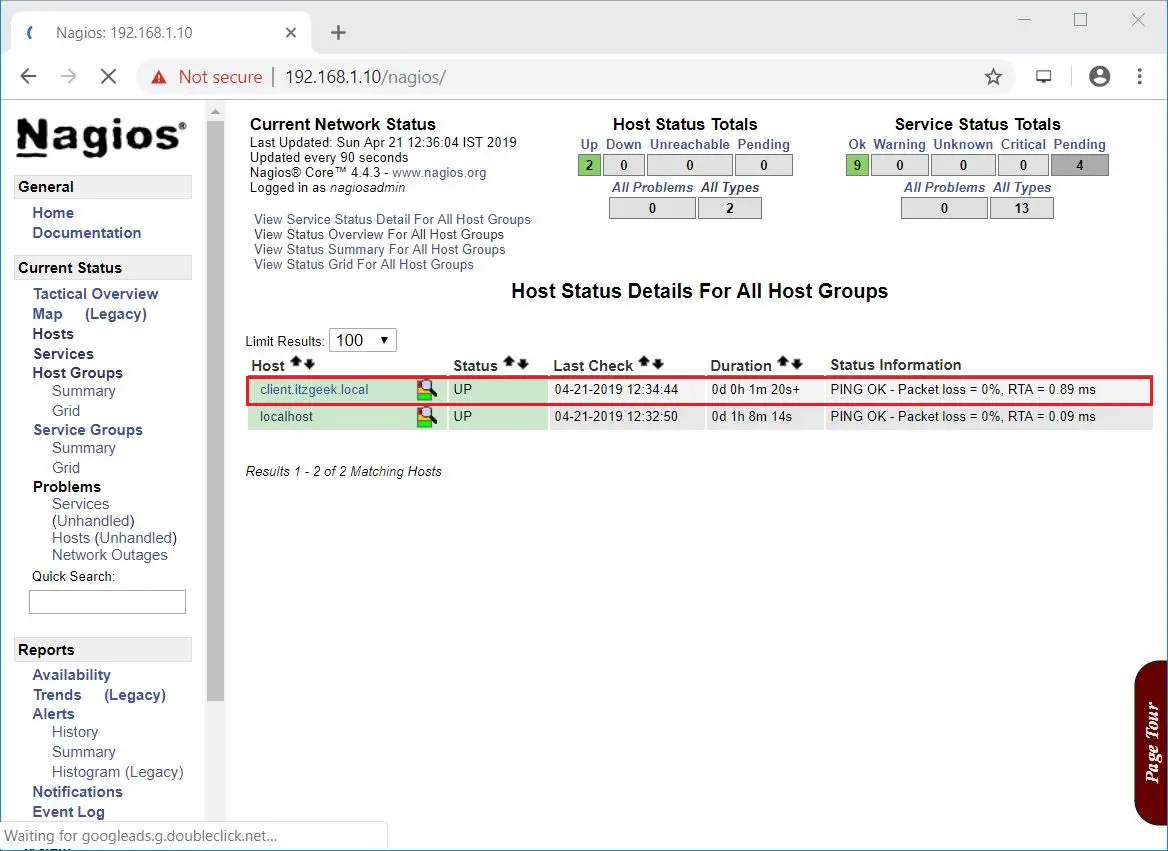
Nagios console will look like below.
Click on Hosts in the left pane to get a list of systems being monitored by Nagios. We have not added any host to Nagios, So it simply monitors the localhost itself.
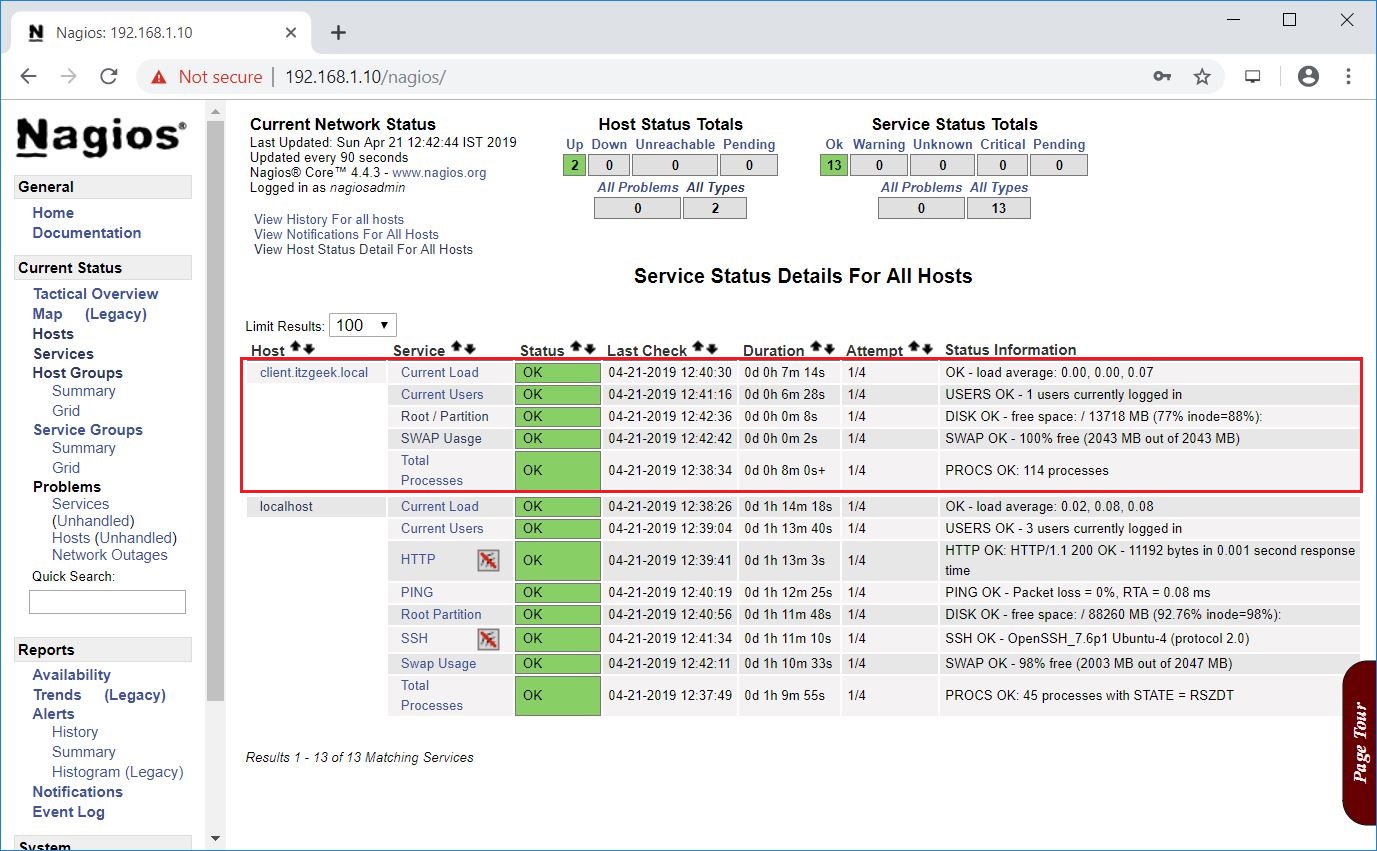
You can now explore the Nagios console, click on Services in the left pane to get the status of any services that are being monitored with Nagios.
Monitor Remote Linux Systems With Nagios Monitoring Tool
Let's now add a Linux Host to Nagios Monitoring tool using the NRPE plugin. Nagios Remote Plugin Executor (NRPE) plugin allows us to monitor applications and services running on remote Linux / Windows hosts.
This NRPE Add-on helps Nagios to monitor local resources like CPU, Memory, Disk, Swap, Online users on the remote Linux machines.
On Remote Linux Machine, we have to install NRPE Add-on & Nagios plugins. We have to configure epel repository on Centos to proceed further.
On a server that you want to monitor, install the EPEL repository:
yum install epel-release -y
Now, install NRPE and Nagios plugin on remote host:
yum install -y nrpe nagios-plugins-all
We have to modify the NRPE configuration file to accept the connection from the Nagios server. For this, edit the /etc/nagios/nrpe.cfg file by adding the Nagios server Private IP addresses.
vi /etc/nagios/nrpe.cfg Line 81 allowed_hosts=<Nagios Server IP>
This configures NRPE to accept requests from your Nagios server, via its private IP address.
Start nrpe Service and nrpe on system startup.
service nrpe start
service nrpe enable
chkconfig nrpe on
Add remote hosts/clients on Nagios server
On your Nagios server, edit the Nagios configuration file to include all .cfg files inside the /usr/local/nagios/etc/servers directory.
vi /usr/local/nagios/etc/servers/yourhost.cfg
Note: Replace the highlighted word, "yourhost", with the name of your host/
Add the following the host definition as below.
define host {
use linux-server
host_name yourhost
alias My First Apache Server
address <Private IP of remote Host>
max_check_attempts 5
check_period 24*7
notification_interval 30
notification_period 24*7
}
With the above configuration file , Nagios will only monitor if the host is up or down. If this is sufficient for you, save and exit then restart Nagios. If you want to monitor particular services, add the below service blocks for services which you want to monitor.
Here are some examples that you can add to your host's configuration file: Ping: define service {
use generic-service
host_name yourhost
service_description PING check_command check_ping!100.0,20%!500.0.60%
}
SSH: define service {
use generic-service
host_name yourhost
service_description SSH check_command check_ssh
notifications_enabled 0
}
Now save and quit. Reload your Nagios configuration to put any changes into effect:
systemctl reload nagios.service
Go and check the Nagios web interface to view the new services we added just now.
Within a minute, you should start seeing status in services page.
Reverse Proxy with Web-servers A reverse proxy server is a type of proxy serve that typically sits behind the firewall in a private network and directs client requests to the appropriate backed serve. A reverse proxy provides an additional level of abstraction and control to ensure the smooth flow of network traffic between client and servers. W e have quite few ways to re verse proxy a particular site or ip address. One among them is by using web servers(Apache httpd & Nginx). Let's deep dive into the configurations. Using Nginx Server Nginx is an open soure, high performance HTTP server, load balance and reveres proxy software. It has a straightfoward configuration language making it...
Auto Build of Jenkins Jobs from local GIT Introduction: We've quite few ways to build the job through Jenkins(manually or automatically), we'll see the other way to trigger the Jenkins job automatically when we commit changes to local git. Step 1: Go to Jenkins home directory and create a repo. cd /var/lib/jenkins mkdir repo Let's initialize this the empty repo using the init command. git init . => this step would initialize the git repo locally Create a file under repo and commit the changes. cd /var/lib/jenkins/repo vi fil...


Comments
Post a Comment